
There has been a lot of buzz about Recruitment Analytics. Many recruitment metrics like quality, time, speed, cost, and productivity are used by organizations to gain insights of the recruitment process.
Agreed! These all are important.
But, are you leaving behind the Pre-Employment Testing Analytics on the table?
Pre-Employment Testing analytics provide an insight into the candidates’ performance and constructions of skill assessments. With the help of pre-employment testing metrics, a hiring manager or recruiter can streamline the selection process, perform detail analysis, consider previous sourcing channels and hire efficiently.
Then why are we not considering this most crucial data seriously?
Because we depend on reports. Reports only provide the raw data, but where is the understanding of candidates’ metrics, decision making for hiring quality candidates. For these metrics, we need to ask why questions. In comparison to reports, analytics offer you the insights of why happened?
Let’s see what the difference between Reports and Analytics.
Difference between Reporting and Analytics
While reporting tells you what has happened, analytics provides insights as to why it is happening and what can be done to make the outcome more favorable.
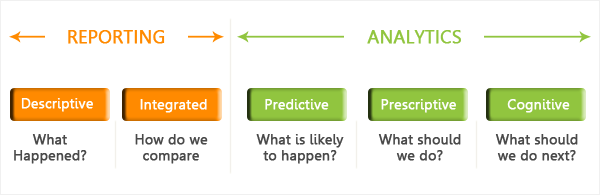
For example, while testing candidate for their skills, reporting tells you how many candidates pass/fail, and who are the top scorers. Analytics, on the other hand, tells you the percentage of candidates who scored above the cut-off percentage and was the assessment too easy or too difficult.
Reporting dashboards are a useful indicator of what has happened, but they don’t even tell you half of the story. Analytics tells you why something has happened and what you should do in the future, and therein lies the difference.
The big question now become: Can we get more “good analytics” without having to spend too much time?
Yes, we can! With iMocha Analytics.
Overview of iMocha Analytics
imocha is happy to launch “Analytics”
One glance at the iMocha analytics and you’ll know exactly how many candidates completed the test, their scores, what was the mean and standard deviation, how was the test, who are your top scores, and not to forget percentile.
The best part is that you now have everything at one place.
To save your time and help you to make data-driven decisions the analytics section has two parts -
1. Test Statistics
Everybody likes to know what’s happening at a certain time, so if you’re the hiring manager at your company or a recruiter, you’ll probably love the iMocha Analytics. It will give you essential information about the -
Candidates Details – candidates details like name, email address the date and time of when he/she attempted the test.
Scores and Status of the test – Calculated scores of the candidates and you can also know the status of the candidate’s test whether the candidate completed the test or left the test.
Percentile – Percentile will tell you how well the candidate performed as compared to the other candidates.
Instant reports – In detail reports provide you with candidates’ summary, answers of the questions, proctoring details and will help you to quickly filter out the candidates based on actual performance.
This data will help you to adjust your hiring plans and sourcing accordingly. Now you just relax and leave rest up to us.
With Test Statistics, you already have information that can help you make better hiring decisions.
2. Test Analysis
Crunching with the numbers... Leave that up to us!
To keep you ahead from your competitors, iMocha now provides the mean and standard deviation of the test. Along with mean and standard deviation, you will also have the graphical interpretation in the form of a pie chart.
1. Pie Chart
This pie chart will provide the information like -
- It will allow you to discover the category of candidate scores.
- A hiring manager or a test maker would want to know this information because it might change how he or she constructs the test. For example, if most of the candidates are falling under the category of more than or equal to 80 percent than your test was too easy. You need to improve the test and likewise. With the help of pie chart, you can set the difficulty level of the test.
2. C, M, and SD
Wondering what C, M and SD stands for?
C is the number of candidates completed the test, M is the mean or average score and SD is the Standard Deviation.
The mean is the average score of the test and Standard Deviation measures how spread out the data is from the mean. When it comes to assessments, standard deviation describes how close to the mean the individual student scores are. If you are interested in digging a little deeper see why do we calculate mean and standard deviation?
Mean and standard deviation will help organizations to consider previously used channels to source candidates using analytics by performing detailed analysis of turnaround time, the performance of a candidate and will help recruiters to allocate resources accordingly.
And, if you are not satisfied with a skill test and want us to improve the test we are 24x7 available for you.
You know, we don’t wanna miss a chance to talk to you ;)
Don’t just collect data, Generate insights with iMocha Analytics
If we take an honest look at how you use analytics in your busy schedule, you will realize
- You look at the reports of the candidates
- You also look at the total number of top scorers and select the top ones
- Maybe, if you have time, you look at the answers and that’s about it.
Wait a minute! These are not analytics, this is reporting.
But with iMocha Analytics it is possible to measure and track the metrics that help you to hire efficiently. With iMocha analytics, you can -
- Measure and track the candidates’ reports
- Predict the most successful hires who will be of high potential
- Understand, track and improve the construction of skills assessments
- Keep a track of the previously sourcing channels with Mean and Standard Deviation
Know how iMocha Analytics works? You now have an ease to access, built-in reports, scores, the percentile of candidates, mean, standard and everything at a go. Amazing… Isn’t it?
Filtering candidates was never too easy! iMocha advanced hiring analytics, assessment integration, and candidate ranking tools will help you streamline the selection process, ensuring best-fit and faster decisions. And, with iMocha, your pre-employment testing analytics will be taken care of.
Now that we have always promised you your productivity, we have worked on that promise to keep you super contented and super happy. The analytics is all set for you, as refreshing as a cup of tea and as easy as pie. And yeah why not, you can just scroll your eyes through this analytics while enjoying your tea.
