If you're in hiring or recruiting, you know that top candidates help you take your organization a step ahead to reach new heights. At the same time, it's harder than ever to find top talent and to outperform the competitors.
In the race to find top candidates, you usually test them for their skills. While evaluating candidates for their skills sure you can measure how many candidates passed or failed, who is the top scorer? But how what about the candidates' strong areas, how do you assess this? Or how about the effect of your skills test? Was the test too easy or it was too difficult? How do you know your tests were relevant? What was the average score of the candidates? How good was the talent pool you sourced?
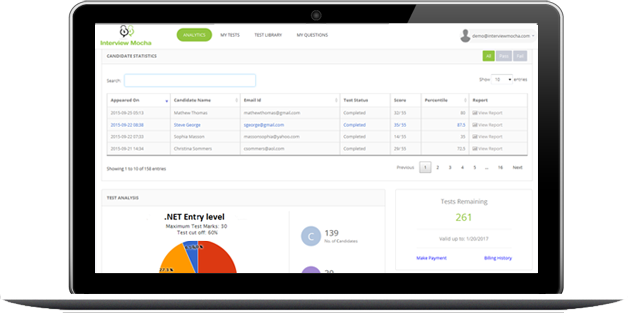
That’s why we’re introducing the iMocha Analytics, a set of integrated data and hiring analytics, designed specifically for the needs of hiring managers and recruiters. It all starts with understanding the skill test at the moment — getting the right insights and then making right hiring decisions.
Companies spend a lot of money on hiring process; it’s difficult to understand which dollars are working and which dollars aren’t. The iMocha Analytics allows you to actually understand and save the other half that isn't working. The iMocha Analytics delivers you the insights you need to set your hiring strategy, bring in top talent, and ultimately outperform the competition.
Here’s a breakdown of what iMocha is offering to its users.
1. Test Statistics
Everybody likes to know what’s happening at a certain time, so if you’re the hiring manager at your company or a recruiter, you’ll probably love the iMocha Analytics. It will give you essential information about the –
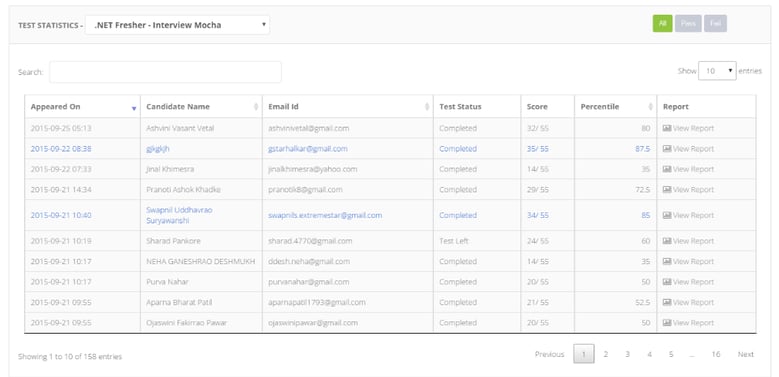
Candidates Details – candidates details like name, email address the date and time of when he/she attempted the test are provided. The names of top scores are flaunted in blue color.
Scores and Status of the test – Calculated scores of the candidates and you can also know the status of the candidate’s test whether the candidate completed the test or left the test.
Percentile – Percentile will tell you how well the candidate performed as compared to the other candidates.
Instant reports – In-detail reports provide you with candidates’ summary, answers of the questions, proctoring details and will help you to quickly filter out the candidates based on actual performance.
This data will help you to adjust your hiring plans and sourcing accordingly. Now you just relax and leave rest up to us.
2. Test Analysis
Crunching with the numbers… Leave that up to us!
To keep you ahead from your competitors, iMocha now provides the mean and standard deviation of the test. Along with mean and standard deviation, you will also have the graphical interpretation in the form of a pie chart.
Pie Chart
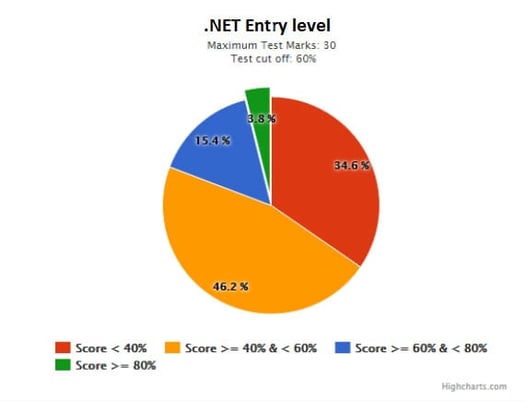
This pie chart will provide the information like –
- It will allow you to discover the category of candidate scores.
- A hiring manager or a test maker would want to know this information because it might change how he or she constructs the test. For example, if most of the candidates are falling under the category of more than or equal to 80 percent than your test was too easy. You need to improve the test and likewise. With the help of pie chart, you can set the difficulty level of the test.
C, M, and SD
Wondering what C, M and SD stand for?
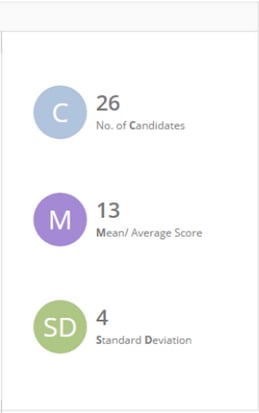
C is the number of candidates completed the test, M is the mean or average score and SD is the Standard Deviation.
The mean is the average score of the test and Standard Deviation measures how spread out the data is from the mean. When it comes to assessments, standard deviation describes how close to the mean the individual student scores are. If you are interested in digging a little deeper see why do we calculate mean and standard deviation?
Mean and standard deviation will help organizations to consider previously used channels to source candidates using analytics by performing detailed analysis of turnaround time, the performance of a candidate and will help recruiters to allocate resources accordingly.
Dedicated iMocha Support
And, if you are not satisfied with a skill test and want us to improve the test we are 24×7 devoted to your success and every step of the way. We’ll start with a thorough need analysis for your business. Then we’ll help you get up to speed, with full support and skill tests.
You know, we don’t wanna miss a chance to talk to you ;)
Smart, Integrated, Intelligent.
As we built the analytics, we kept in mind what hiring managers and recruiters need.
See the complete test analysis – Hiring requires full visibility and context to see what’s really happening, how the candidates are performing and are the skills test relevant. Consider previously used channels to source candidates with detailed analysis.
Useful insights, not just data - Hiring managers need enormous computing power, data science and smart algorithms, all working together to quickly make sense of data for them. In other words, measurable insights those are easy to see.
Enable better sharing – Recruiters seek to put insights into everyone’s hands and get the whole company on the same page, resulting in stronger goals and smarter decision-making.
The iMocha Analytics is built to address these needs. It’s powerful reporting, ease of access, the percentile of candidates, mean, and standard deviation everything at a go. Simply put A complete measurement platform.
This is just the beginning of our ongoing innovation in hiring analytics - we can’t wait to share more. Over the coming weeks, we’ll dive into the capabilities and benefits of newly refreshed and renamed iMocha solutions.
If you have any thoughts about this analytics launch, please let us know in the comments. We’d love your feedback.
